Housing Voids systemic redesign
How local government and landlords manage the transfer of a property from one tenant and the other, involves the tenant leaving, a team that repairs and refurbishes the property, and the new tenant arriving. The refurbishment usually involves several sub-contractors that deal with issues like gas safety checks and electrical works. In local government, this service is often mired in loss of rental income, and significant costs when refurbishing properties - especially those that are trashed.
This case study demonstrates a systemic approach to taking a poorly designed service, and how we turned that around.
This case study demonstrates a systemic approach to taking a poorly designed service, and how we turned that around.
Where to start - the Directors dilemma
The Directors problem as it was expressed at the start
- Our measures are not good, the void costs are too high, and the void time is increasing.
- Our relationship with the voids and repairs contractor is poor.
- And we dont have an agree voids process!
So we decided to start a redesign. And this is who was involved:
- Dawn Jolliffe – voids operative
- The housing director
- A voids inspector – part time
- An internal consultant Natalie, and myself
The design method
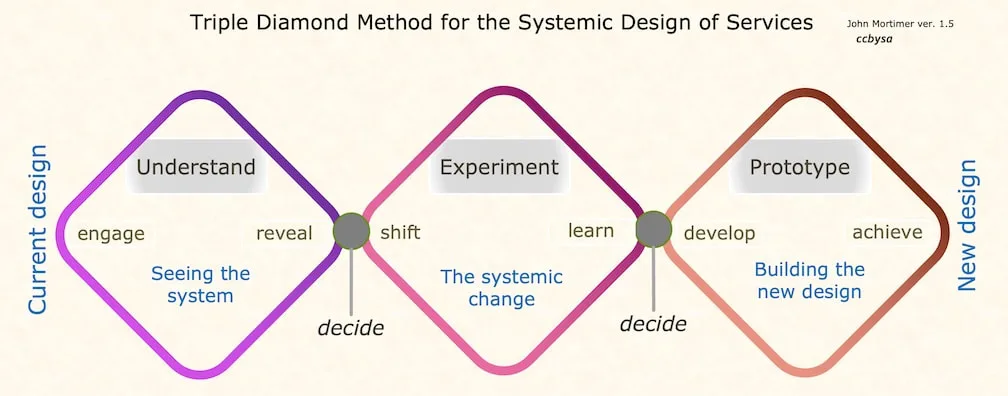
This is the test and learn method we followed
Seeing the current system
Week 1 - We began by trying to understand the end to end flow of work for a void property.
These were some of the main comments from Dawn during the first week:
- Why am I here?
- I have been bullied dover the past year.
- I don’t actually know what voids is
- I don’t know how a void really works.
Week 2-3
We simply decided to follow real voids, to understand and learn how the system operated, and how people worked within it.
- waiting for keys when they came in, and then talking to the tenants about what their communication with us has been like.
- we followed the journey of the keys.
- we went out with the voids inspector and then with the contractor.
- we attempted to understand what mattered to the new tenant moving in.
We were creating a flowchart of what we saw.
This is what we found were the main ways the system behaved.
The start of the experiment - test and learn
This was to leave behind the current way of working, and to then use innovative approach of safe to fail, or test and learn, to learn what we could by taking real properties and making them ready for letting. As a team we sat in the room, and came up with a set of principles that would cause us to work very differently than how we had before.
And we began to take new voids, and work with them using these new principles
- Start with the actual situation, and what matters to the property and the tenant.
- Work as one, work as a team.
- This is about learning, not coming up with solutions.
- Make decisions based on evidence not opinion.
- Strive to only do value work.
- Treat data with suspicion.
And we began to take new voids, and work with them using these new principles
A new approach, starting with purpose and what matters
Primary measures are those that focus the whole organisation. They are the ones that tell us most about what we do and how we do it. Therefore they are the most important.
Systemic service measures are defined as: that which helps us to understand what is going on in the service,
and,
how well are we doing with respect to our purpose (defined by our customers),
...so that we can learn and improve
PURPOSE & WHAT MATTERS
To begin the measurement framework we start with Purpose, and ask ourselves how do we measure achievement of purpose as defined by the customer or citizen. Purpose can then be split into:
- the what we do, and
- the how we do it
How we do it, an example of a measure, might be defined as;
What Matters is obvious when each customer interacts with us.
Every service has a purpose and I have only given one simple example. The main point is that the purpose and what matters to customers is a fundamental starting point. It is core to defining a person-centred service. This focus leads everyone in the organisation in being mindful of the customer in every activity and interaction. It therefore is the core of the re-design and the design of measures.
These principles, from John Seddon, underpin the move from old to new ways of measurement.
And, these are some principles which define behaviour (so that we dont revert back to the old ways)
And one last thing, the use of measures should develop into learning cycles, where the value of the service is continually improved over time.
And, these are some principles which define behaviour (so that we dont revert back to the old ways)
- measures should be in the hands of those who do the work (visible on the wall), so that they use them to understand and improve.
- customer purpose and what matters to customers must be derived from the work (not in a room) and drives our workflow design.
- used to analyse and understand, and by managers to improve the system.
- they measure what is real and happening, and demonstrate true variation over time. (they are not targets, or averages)
- distinguish between focusing on understanding the variation between individual customers (individual comparison - rather ineffective), and understanding the systemic design (trends - what we are interested in)
And one last thing, the use of measures should develop into learning cycles, where the value of the service is continually improved over time.
The measures
In our initial analysis of how the current service behaves, we realised that the measures were created by managers with a particular mindset and behaviours;
- we manage and make decisions from the graphs we receive
- we measure time workers spend doing any activity, and reward them when they reduce the cost of that activity, regardless of its value.
- use set targets, and use them to measure the performance of the contractor.
What we found
The measures the organisation used and what we found;
The problems this caused were;
- as the contractor was paid according to the measures, the targets caused the contractor to cheat the figures and hide the work they did.
- the relationship between the contractor and the organisation was poor, progress meetings were simply arguments from different peoples points of view.
- the managers did not have an understanding of the true performance of repairs.
- causes of problems were not known, and therefore not remedied.
Repairs were categorised, as emergency (1 day), urgent (5 days), and standard (28 days).
This categorisation caused the council to force a level of service on the resident of the house. regardless of how urgent the person thought they were. Complaints into the organisation were legendary!
In our new systemic design, we wanted to use measures;
- to demonstrate how well the new design prototype was working compared to the current way of working.
- to help senior leaders to develop true understanding, and to
- to develop a customer (House-centred) view of the service.
- to aid in developing a good relationship with the contractor.
In the experiment, as we analysed each repair we undertook, we record as much information as we think we might need, and make it very visible. The result is in the picture below.
- we manage and make decisions from the graphs we receive
- we measure time workers spend doing any activity, and reward them when they reduce the cost of that activity, regardless of its value.
- use set targets, and use them to measure the performance of the contractor.
What we found
The measures the organisation used and what we found;
- number of repairs per month; we found that many repairs were logged more than once, as two or three separate repairs. Making this figure quite meaningless.
- average cost of each repair; this was such an overall figure, and it was averaged, it meant nothing. It did not give any indication of as to the causes of the cost.
- average time to complete the repair; this meant nothing as some repairs were much easier to complete.
- repair types; it was interesting to read, but served little purpose.
- repairs that failed the target time; the target time was the same for all repairs, so those that took longer would always fail, hence that is why some repairs were split into two separate repairs, to make them fit into the target.
The problems this caused were;
- as the contractor was paid according to the measures, the targets caused the contractor to cheat the figures and hide the work they did.
- the relationship between the contractor and the organisation was poor, progress meetings were simply arguments from different peoples points of view.
- the managers did not have an understanding of the true performance of repairs.
- causes of problems were not known, and therefore not remedied.
Repairs were categorised, as emergency (1 day), urgent (5 days), and standard (28 days).
This categorisation caused the council to force a level of service on the resident of the house. regardless of how urgent the person thought they were. Complaints into the organisation were legendary!
In our new systemic design, we wanted to use measures;
- to demonstrate how well the new design prototype was working compared to the current way of working.
- to help senior leaders to develop true understanding, and to
- to develop a customer (House-centred) view of the service.
- to aid in developing a good relationship with the contractor.
In the experiment, as we analysed each repair we undertook, we record as much information as we think we might need, and make it very visible. The result is in the picture below.
each repair visible on the wall
I work with the front line team to decide what the new measures are going to be. The final measures were decided by the whole team together with the manager.
Deciding what to measure
To develop a new approach to measures, we need something that focuses us away from what we have done before. So, we started with the main areas of;
purpose & what matters, efficiency, revenue, morale (culture).
PURPOSE
- Purpose of the service was defined as
the what; 'bring the property up to the standard.'
the how; 'repairing the house within the expected time.'
We measured this purpose by recording the end to end time for each repair. (start to finish for each repair)
WHAT MATTERS
This was different for each house. We ended up measuring the number of repairs that had to be made, and estimated completion date by the contractor. Some were very urgent; for example heating not working in the winter. Others could be completed when necessary.
VALUE
The actual number of days to complete the repairs, compared to the estimate. Good is the days taken = the estimate
EFFICIENCY
The amount of rework we had to do, after we had completed the repair.
REVENUE (SPEND)
- cost per repair type.
- cost variation for each repair.
The very useful thing we did was to help the managers to link cost (which they care lots about) with causes of cost.
cost is driven by causes
This is about showing that if we look at the causes of cost, then costs reduce.
MORALE
- Morale was described by the team directly in feedback to managers and leaders. It was evident in their dialogue, behaviour, and attitude.
The impact on one member of staff was profound. Before we started, she was very demotivated in her work. She disliked her colleagues and felt her manager did not trust her. When she tried to raise something that needed changing 'You're just an admin' was the reply. She was continually put in her place.
After the redesign work, she became the lead in the new design, and led the operational work. She took charge of the contractor meetings. She ended up supervising three members of staff. She loved her job, and remembers the redesign prototype as a great development experience for her. She continues to embed the new working culture into her team.
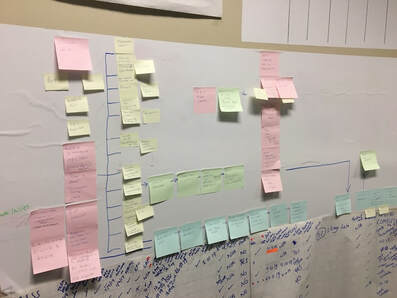
Collecting the information
Each of the repairs were recorded in as much detail as we thought we would need, on the wall of the room.
The details of the live repairs
We created new measures. We wanted to compare the new way of working with the old way of working.
You can see from the graph below, the improvement in end to end time, from the old design to the new design. This step change is an example of a systemic change, and it is this step change, rather than individual repairs, that we are more interested in. Comparing old vs new is an important tactic in redesigning services as if helps us to see how well the new design is working.
We can see in the graph below, we can see variation between each repair. However, the variation in the individual repairs, is in itself is not so important to us. What are more interested in are the patterns we see in the graph. Look at it and what do you see?
We saw;
Variation between properties was far more than we expected, and points to delays that cost us lost rents.
We found that some properties were fast tracked, and this delayed other work.
The average end to end time meant little to us so we created new measures based on common types of repairs.
We saw that this variation reduced when we had greater control of the repairs, and therefore we realised that low variation is a good indicator of good control.
Lower variation meant that the operations were becoming more controlled and also more predictable.
The greatest impact we got from the measure was the step change that we saw between the old and new way of working.
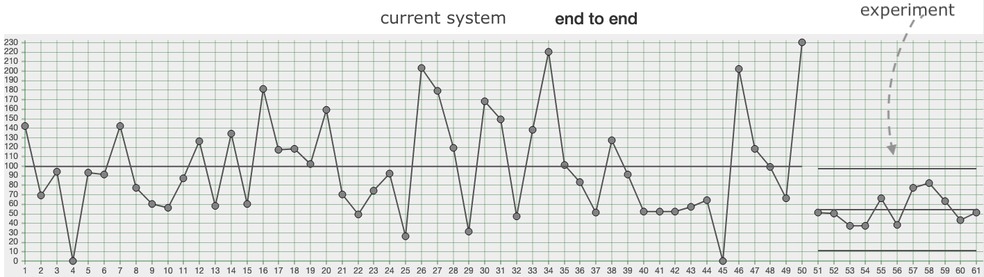
End to end time - dont focus on the individual data points, look at the trends and variation
Not everything we wanted to learn about was a data measure. So we created temporary indicators that helped us to gather what we wanted to know below.
Indicators. Note that they are sometimes subjective.
Measures in the hands of those doing the work
Why have everything on the wall? The impact of putting it on the wall was really profound and helpful. The team had the measures in the room with them at all times. The measures became theirs because they were the ones developing and changing them. The interpretation and learning from the measures would develop over time, and became part of weekly team discussions and reviews.
When we wanted to have updates with the contractor, the real measures were present in the room. The old meetings with the contractor were fraught with arguments. Now, they were based on real time data, and what was measured was helpful to learn from, rather than blame.
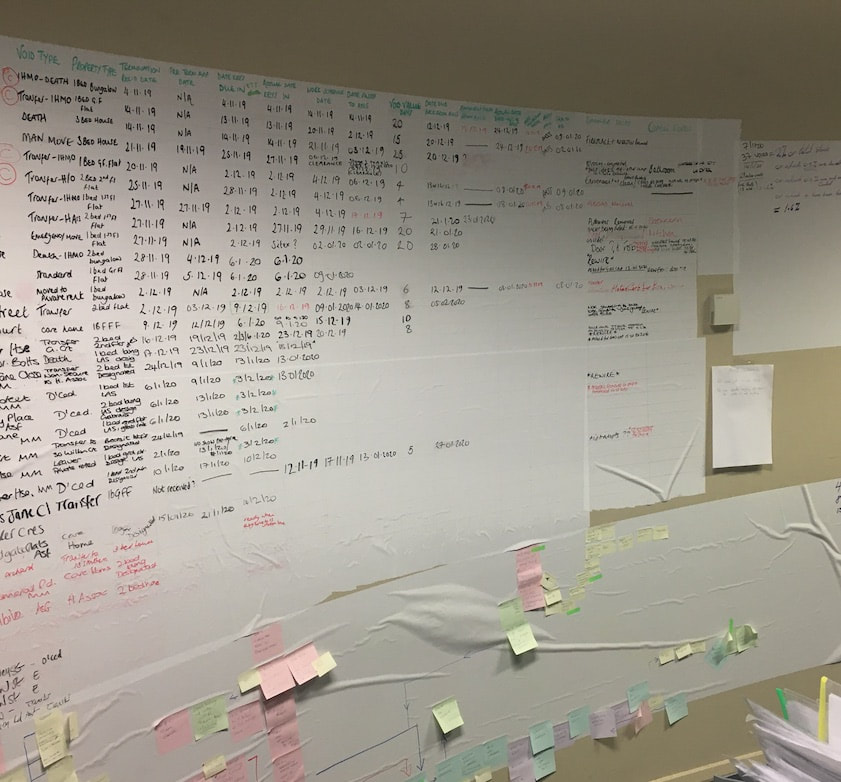
The team developed a sophisticated tracking method to understand what stage each repair was. This became a live spreadsheet, on paper, and then on replicated on Excel. The team preferred the immediacy of the whiteboard, and the amount to information it can contain. That whiteboard could be modified immediately.
A year later, once the behaviours had changed, and everyone was familiar with the new way of working, the tracker was placed by a digital workflow.
When we wanted to have updates with the contractor, the real measures were present in the room. The old meetings with the contractor were fraught with arguments. Now, they were based on real time data, and what was measured was helpful to learn from, rather than blame.
The team developed a sophisticated tracking method to understand what stage each repair was. This became a live spreadsheet, on paper, and then on replicated on Excel. The team preferred the immediacy of the whiteboard, and the amount to information it can contain. That whiteboard could be modified immediately.
A year later, once the behaviours had changed, and everyone was familiar with the new way of working, the tracker was placed by a digital workflow.
Some other the Key measures we used
the planned time compared to the actual time it took for a repair
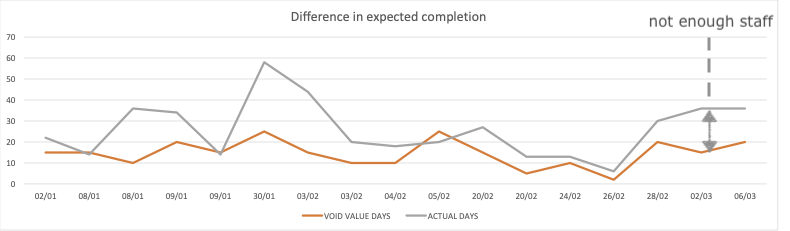
this graph gave a comparison between the expected and actual contractor performance. The gap between the two lines is important.
The gap between each line shows at a glance, the difference between what we expected to do, with what we actually did. When we looked at the detail of this, we discovered that the contractor did not have enough staff to do all the repairs we were pushing onto them. The organisation was then able to help them with this, and the gap reduced.
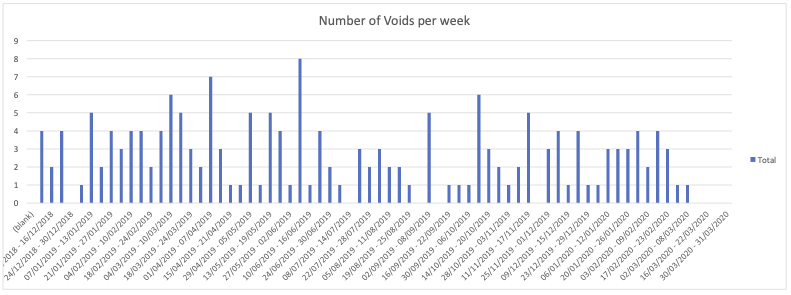
used to track demand and resources over time
The variation in the number of properties coming in some weeks was far higher than than other weeks. This is telling us that we are grouping together our properties and passing them to the contractor in batches. This was not helpful for the contractor who needed to arrange workers to do the work. Once we knew this, we could reduce that variation and that helped the contractor.
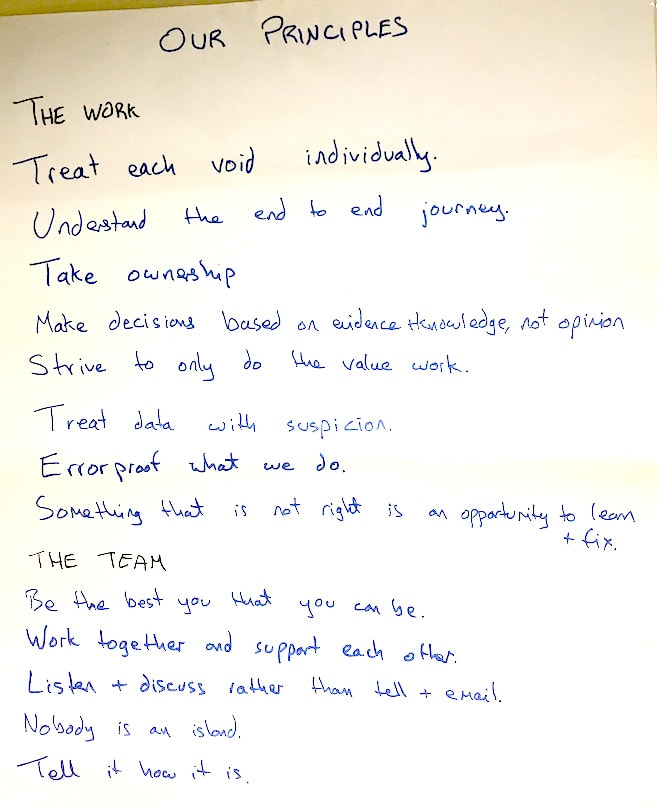
The new working principles that the team developed
After some weeks, Dawn got in her stride and took ownership of the whole Voids service. She also took up the relationship with the contractor, and held regular progress meetings with them. She worked closely with both the voids inspector, and the contractor so that the service design that emerged had been designed amongst the three of them.
At this point I left them, and Dawn has continued to refine and create a solid team around her.
At this point I left them, and Dawn has continued to refine and create a solid team around her.